Back to work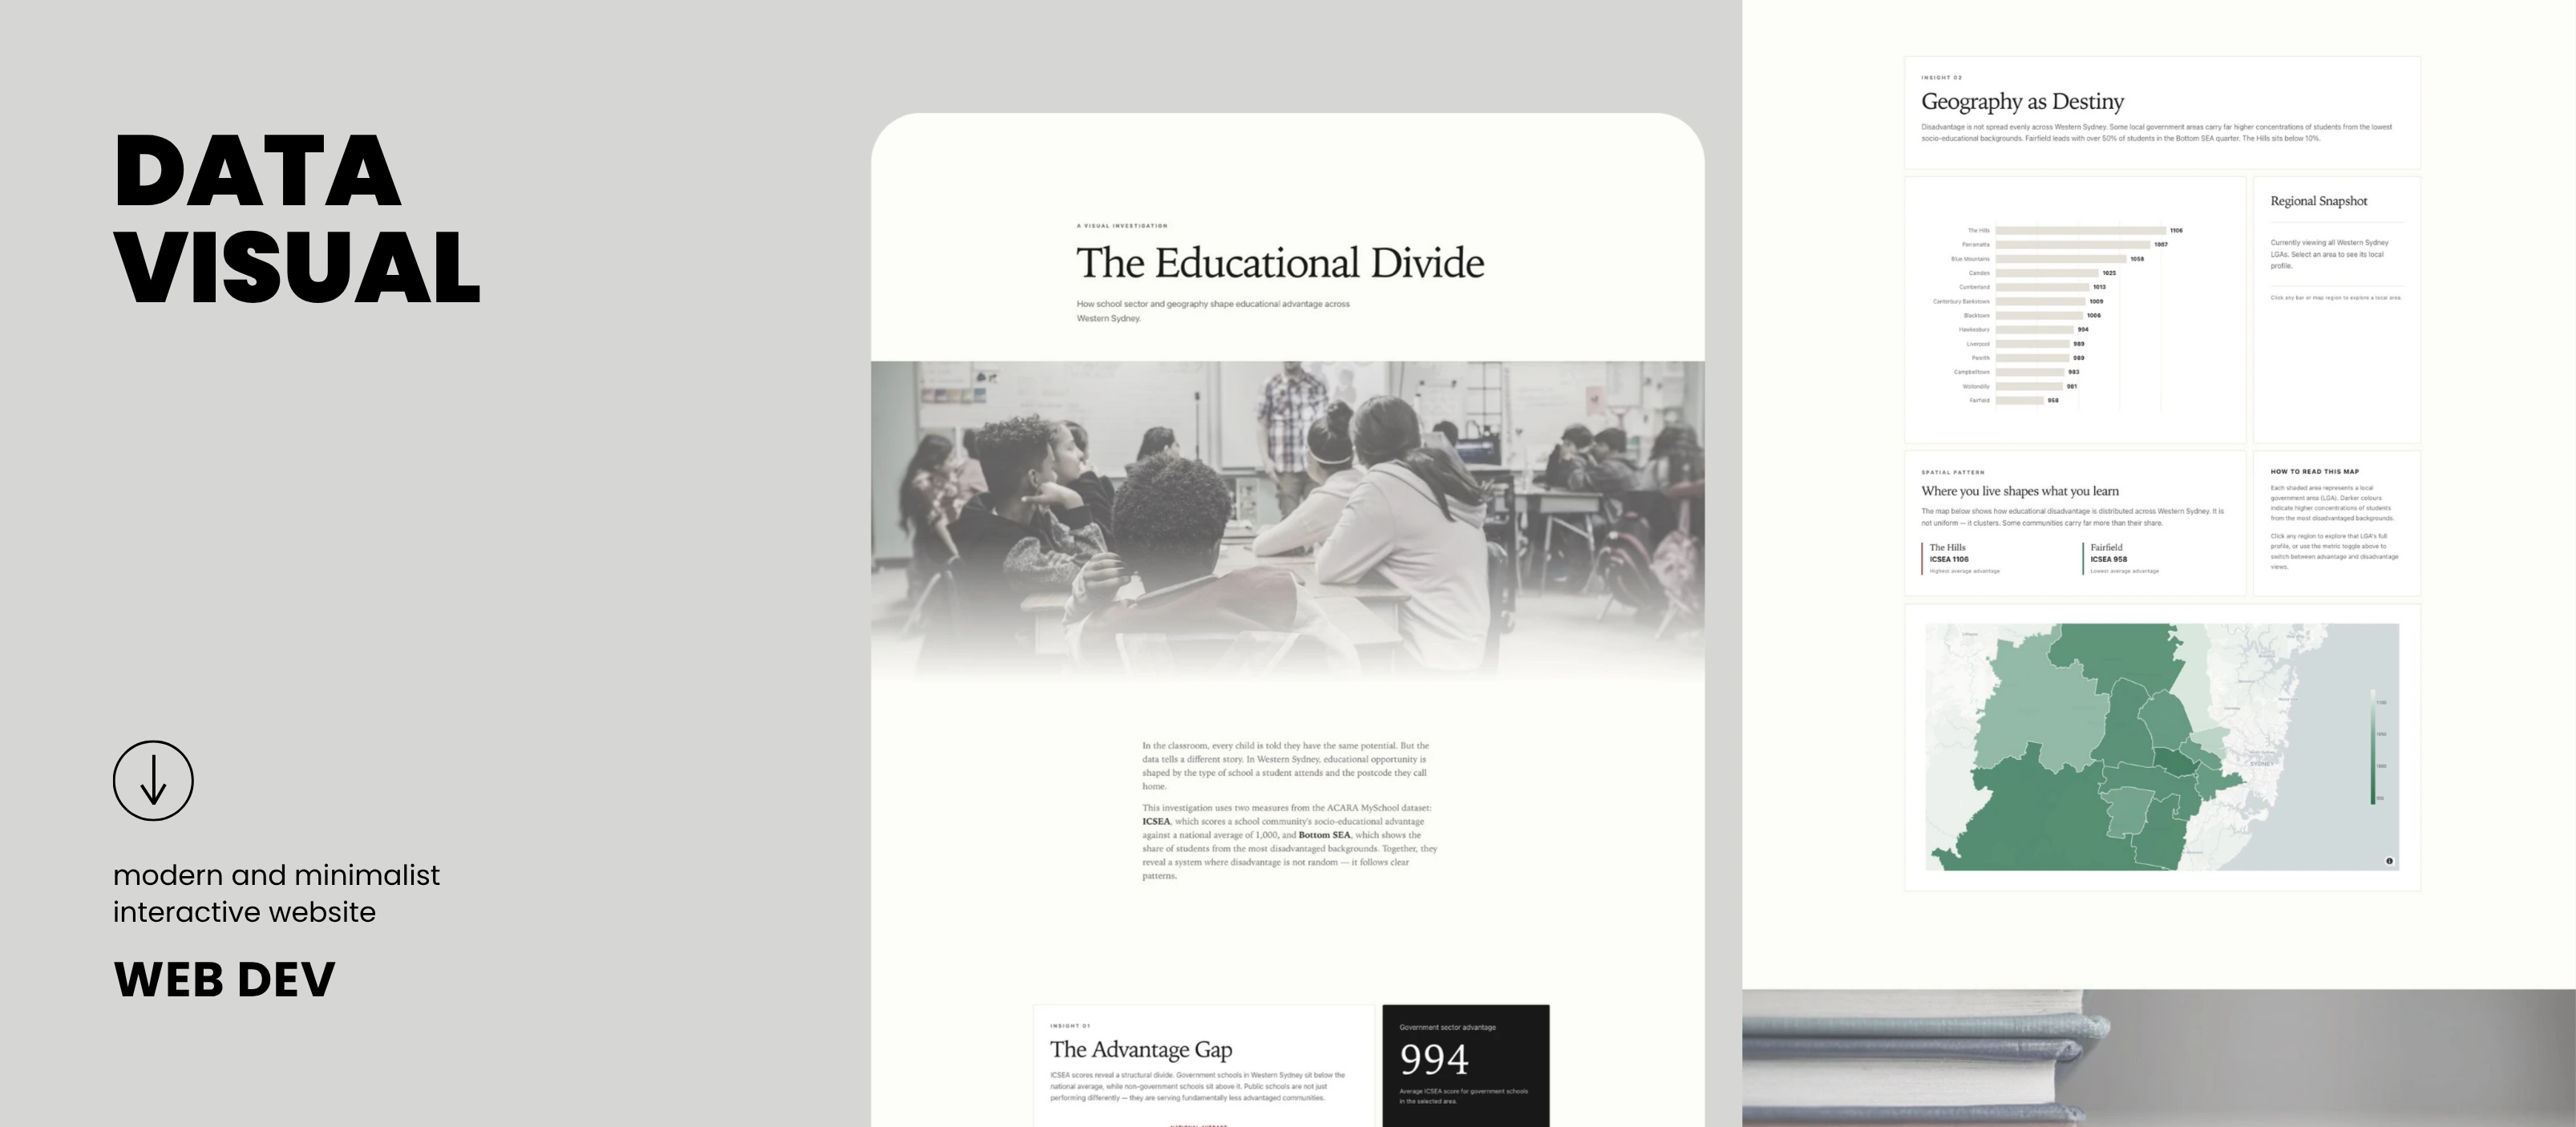
Technical2026
The Educational Divide — Western Sydney
Client
Final university assignment
Year
2026
Category
Technical
Services
Data Visualisation, Interactive Web Development, Data Storytelling
Results
Interactive exploration of education inequality across Western Sydney
Clear narrative structure for non-technical audiences
Responsive, mobile-friendly visualisation layout
Dataset-driven components designed for iteration
Brief
Create an interactive, accessible data story about education inequality in Western Sydney as the final assignment for Data Visualisation and Interactive Web Development.
Challenge
Education inequality is multi-dimensional and easy to misread when reduced to a single number. The goal was to make patterns legible while keeping context and avoiding misleading comparisons.
Solution
Built an interactive web experience that combines guided narrative with exploration: users can compare regions, filter indicators, and read short explanations that translate the data into plain language.